

Kaiko, exploring crypto market data
For Kaiko, a crypto-asset market data provider, STEPS developed an exploration and analytics platform: advanced visualisations, custom filters and timeframes, customisable dashboards and fine-grained user management.
VOLUME AND LIQUIDITY
Dense market data, to be made readable
Kaiko provides reference data on crypto markets. For its clients to make the most of it, a visual, fast and configurable exploration tool was needed.
Prices, volumes, liquidity, derivatives: crypto markets produce data continuously, across hundreds of assets.
Raw tables are not enough to spot a trend or compare assets.
Each user follows their own assets, periods and indicators.
Data and views are not the same for every profile.
Filter, compare, visualise
Try it: change the asset or the period.
ASSET
PERIOD
AGGREGATION
Each filter redraws the chart instantly: asset, exchange, period and aggregation.
Explore Data and Trend of the Week
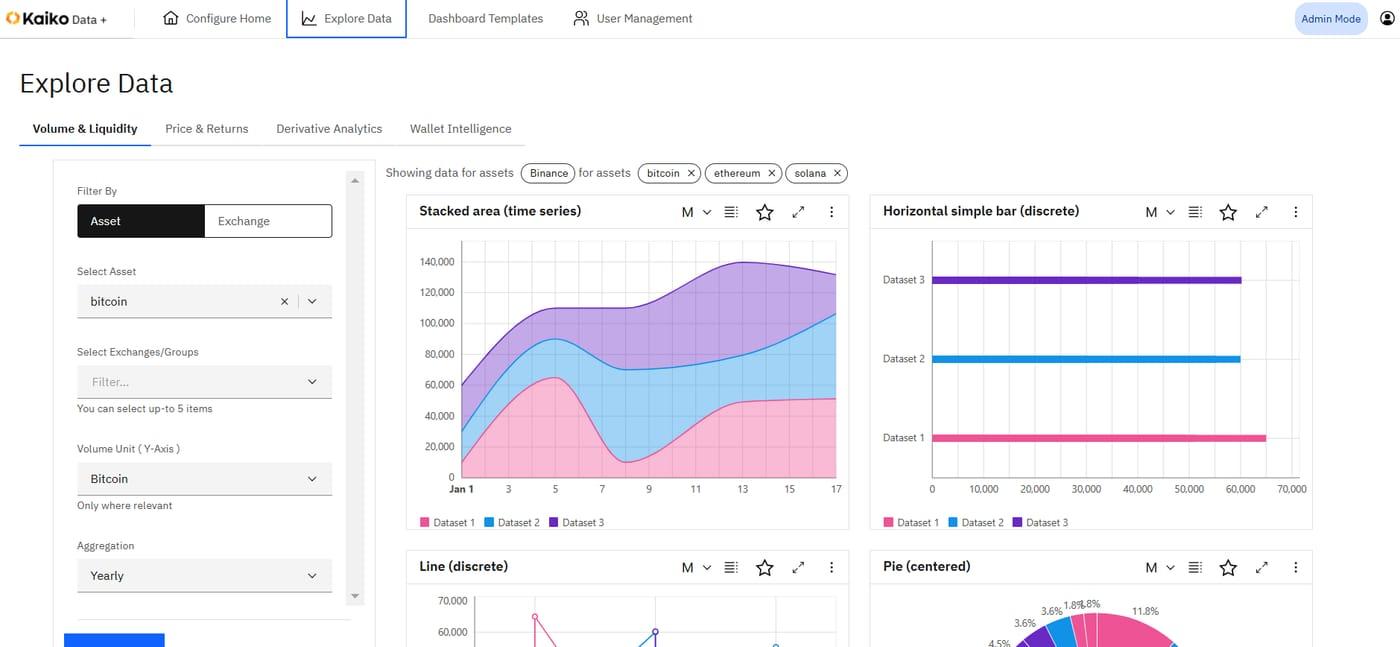
Explore Data: volume and liquidity, price and returns, derivatives and on-chain intelligence, with stacked areas, bars, lines and pie charts.
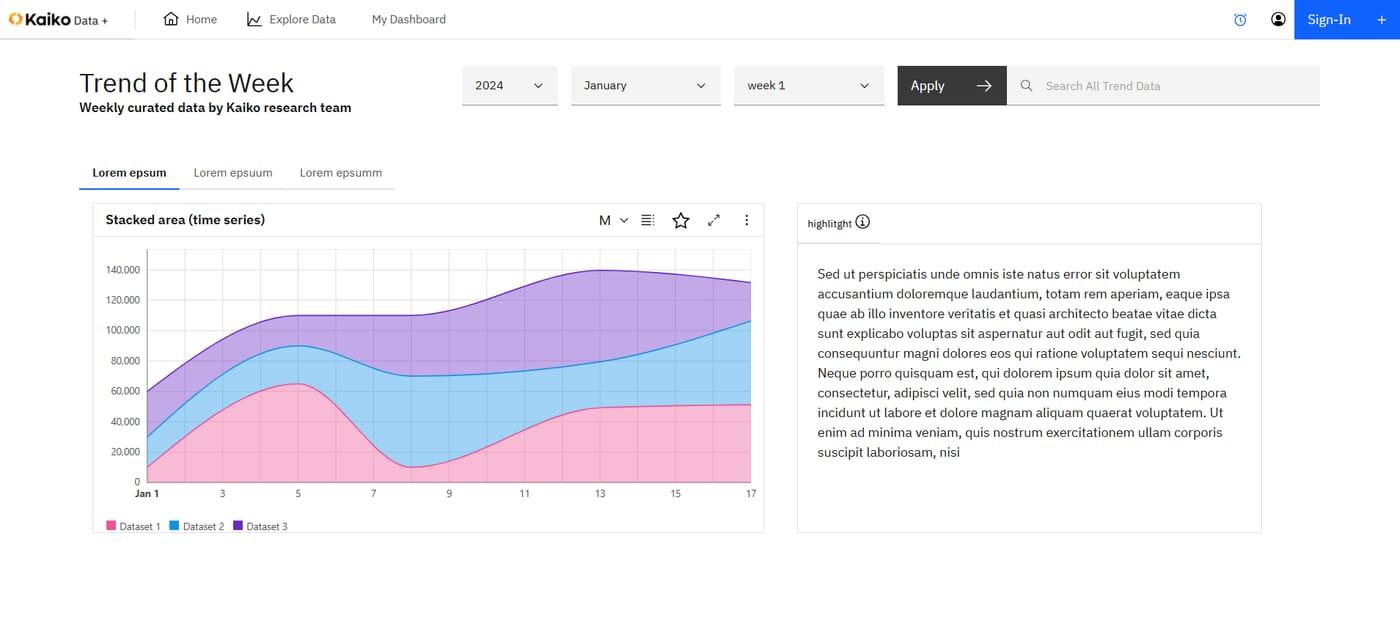
Four spaces in one platform
Each client builds a home page with the content that interests them, including the research team's weekly selection.
- Trend of the Week
- Configurable blocks
Market data explored by theme, with filters by asset, exchange, period and aggregation.
- Volume and liquidity
- Price and returns
- Derivatives
- On-chain intelligence
Ready-to-use dashboards that each user adapts and saves.
- Customisable charts
- Favourites
Account, role and permission management, at the finest level.
- Roles
- Granular permissions
What the platform changes
Market data that is finally readable for clients, and a stronger offering for Kaiko.
Faster, sharper analysis
- Visible trendsVisualisations bring market movements to the surface.
- Free explorationAssets, periods and filters combine without limits.
- Personal viewsEach user keeps their own dashboards.
A better-valued data offering
- Higher perceived valueData becomes a visual product, not just a feed.
- Controlled accessRoles and permissions follow each client's contract.
- Research in the spotlightThe research team's analyses are published every week.
From raw data to visualisation
Exploration journeys, chart types and user profiles.
Exploration screens, dashboards and visualisation components.
Data exploration, dashboards, configurable home page and rights management.
Testing, chart performance and deployment.
Under the hood
A data visualisation web application connected to Kaiko's market data.
sources: Kaiko market data
exploration: asset, exchange, period, aggregation filters
visualisation: stacked areas, lines, bars, pie charts
dashboards: templates, favourites, customisation
access: users, roles, granular permissions
Frequently asked questions
Are the charts customisable?
Yes. Each chart can be filtered by asset, exchange, period and aggregation, and added to a dashboard.
Can different rights be managed for different clients?
Yes. Roles and permissions are managed at the finest level, user by user.
Does this type of platform suit other data?
Yes: financial data, market data, economic data or any time-series data.
Does your data deserve better than a table? Let's talk about your visualisation platform.
Book a scoping session ↗